
For this assignment, we will investigate the polar equation
and compare it with the equation
for various k values while holding the a and b values constant, i.e. a = b.
To begin this investigation, let's set a = 1, b = 1, and k = 0. Can you predict what the graphs will look like?
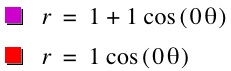
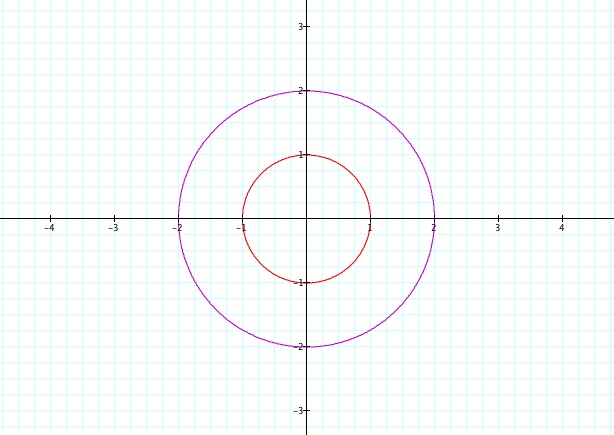
As you can see from the graph below, the graphs look almost identical except they have different radius measures when centered at the origin. The red circle which represents r = 1cos(0) has a radius equal to 1, and the purple circle which represents r = 1 + 1cos(0) has a radius equal to 2. This is because the cos(0) is equal to 1, thus r = 1cos(0) is equivalent to r = 1, and r = 1 + 1cos(0) is equivalent to r = 1 + 1 = 2. Next, let's observe the graphs below when a = 1, b = 1, and k = 1.
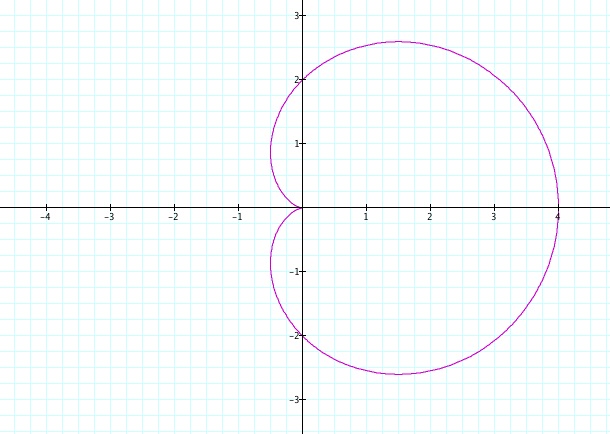
We can see from the graph above that the purple graph is in the shape of a sideways heart. This graph is called a cardioid. Notice that it crosses the x-axis at (2,0), crosses the y-axis at (0,-1) and ( 0,1), and comes to a point at the origin. Let's focus on the graph of the cardioid for a bit. What do you think will happen to the cardioid graph by changing the a and b values? Will larger values affect the size of the cardioid? Let's investigate when a = 2, b = 2, and k = 1.
![]()
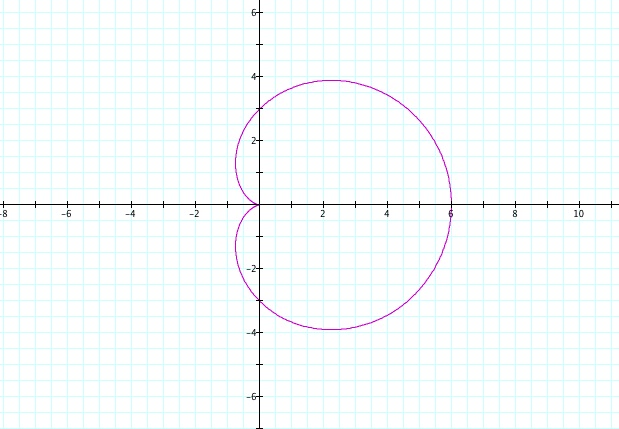
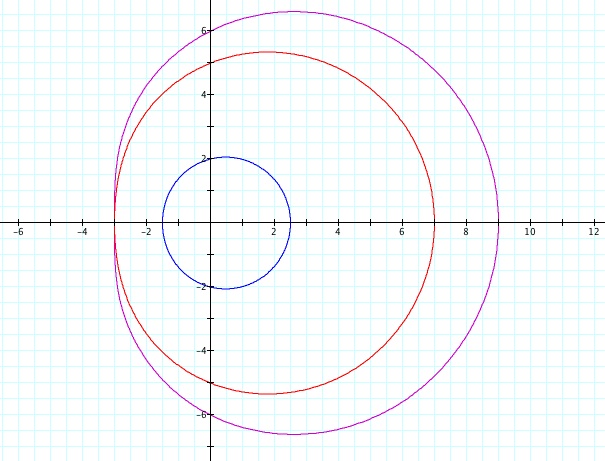
From the graphs above, you can see the two look very similar. However, the cardioid formed by the equation r =2+2cos(1ø) is larger than the cardiod formed by the equation r =1+1cos(1ø). The cardioid above is stretched horizontally along the x-axis, and stretched vertically along the y-axis. It crosses the x-axis at (4,0), crosses the y-axis at (0,2) and (0,-2), and comes to a point at the origin (0,0). Notice that the x-intercepts and y-intercepts are twice the x-intercepts and twice the y-intercepts of the cardioid r = 1+1cos(1ø). Will the x-intercepts and y - intercepts of the graph r =3+3cos(1ø) be three times the x-intercepts and three times the y-intercepts of r = 1+1cos(1ø). Let's investigate the graph when a = 3, b = 3, and k =1.
![]()
From the graph above, you can see that the x-intercept is (6,0) and the y-intercepts are (0,-3) and (0,3) which are three times the x-intercept of (2,0) and three times the y-intercepts of (0,-1) and (0,-1) of the graph r = 1+1cos(1ø). Next, let's explore what kind of changes occur when a and b have negative values.
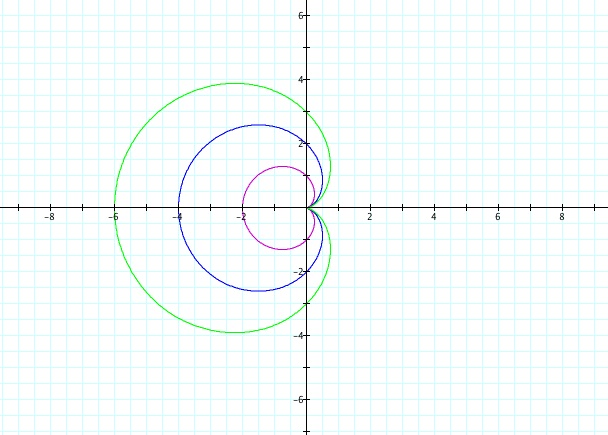
Notice the graphs have the same cardioid shape; however, notice that the negative a and b values cause the graphs to be reflected about the y-axis. Also observe that all of the graphs in the form r = a+bcos(kø) when k = 1 are symmetric about the x-axis. Let's observe what happens when cosine is changed to sine and graph the equation r = a+bsin(kø) with a = 2, b = 2 and k = 1. Then, compare it to the graph of r =a+bsin(kø) with a = -2, b = -2, and k=1.
![]()
graph.jpg)
![]()
.jpg)
When we look at r = a + bsin(kø) when k = 1, we can see that the graphs look similar to the graphs of r =a + bcos(kø) when k = 1. However, you can notice that the symmetry is now about the y-axis instead of the x-axis. From the graphs, you may observe there is a pattern. The y-intercept for this graph is (0,-4) or the ordered pair (0, (a+b)) and the x-intercepts are at (-2,0) and (2,0) or (-a,0) and (a,0).
All of the graphs investigated above have had a k value equal to one. Try to think of what may happen to the shape of the graphs when the k value is increased and decreased. Let's begin by observing what happens when k= 2.
![]()
.jpg)
![]()
graph.jpg)
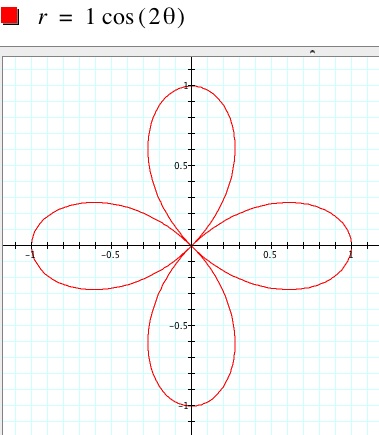
As you can see, we no longer have a graph of a cardioid. Instead, the blue graph which represents the equation r =1 + 1cos(2ø) is the equation of the "k-leaf rose" when a = b. Since k is equal to 2, we obtain a graph with 2 leaves. It has x-intercepts of (-(a+b),0), (0,0), and ((a+b),0). In this case, we have x-intercepts of (-2,0), (0,0), and (2,0). The purple graph represents the equation r = 1cos(2ø) and the graph resembles a 4-leaf rose. Next, let's observe several different graphs simultaneously as k changes integer values but a and b remain equal to 1.
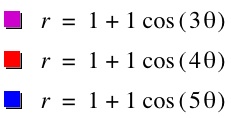
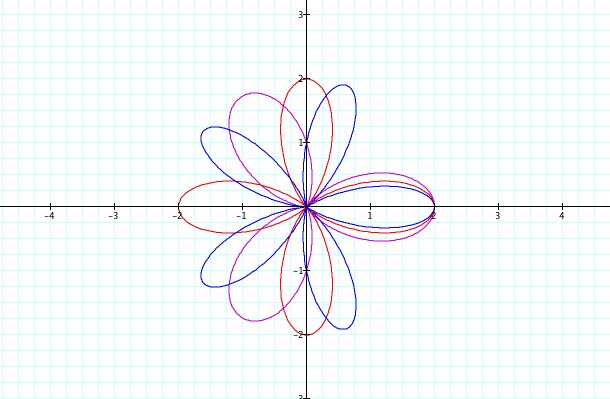
As you can see from the top graph, r =1 + 1cos(kø) when k = 3, the graph is a 3 leaf rose, when k = 4 the graph is a 4 leaf rose, and when k = 5 the graph is a 5 leaf rose. However, the bottom graph of the equation r = 1cos(kø) has some different qualities. When k = 3, it is a 3 leaf rose, when k = 4 it is an 8 leaf rose, and when k = 5 it is a 5 leaf rose. Obviously, there is a difference in the number of petals produced in the graph of r = 1cos(kø) when the k value is odd or even. Let's separate these graphs based on the odd and even values of k in order to investigate the polar equations even more.
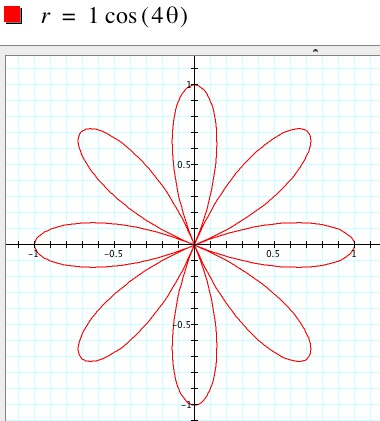
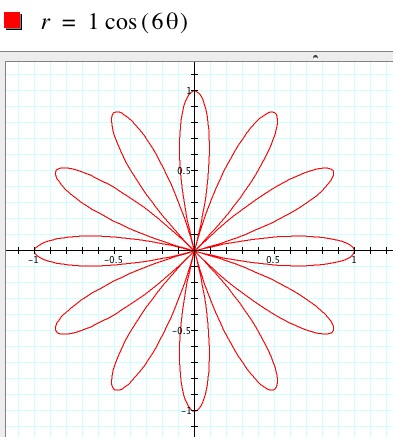
By examining the graphs above, when k is an even integer, the number of pedals double the value of k. In other words, if k= even number, then there will be 2k pedals or leaves on the rose, thus resulting in a 2k-leaf rose. This is shown in the graphs above, when k = 2 the graph has 4 pedals, when k = 4 the graph has 8 pedals, and when k = 6 the graph has 12 pedals.
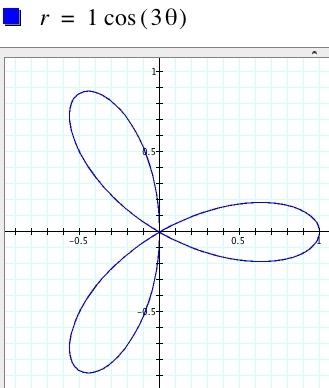
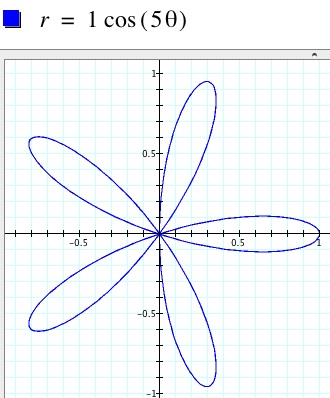
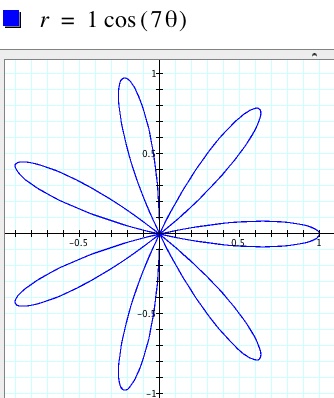
By examining the graphs above, when k is an odd integer, the number of pedals equals the value of k. Thus, we will have a k-leaf rose. Observe when k = 3, the graph has 3 pedals, when k = 5, the graph has 5 pedals, and when k = 7, the graph has 7 pedals. Observe the animations below.
Below is the graph of r = a + bcos(nø) with n ranging from -20 to 20 and a = b = 1.
Below is a graph of r = bcos(nø) with n ranging from -15 to 15 and b = 1.
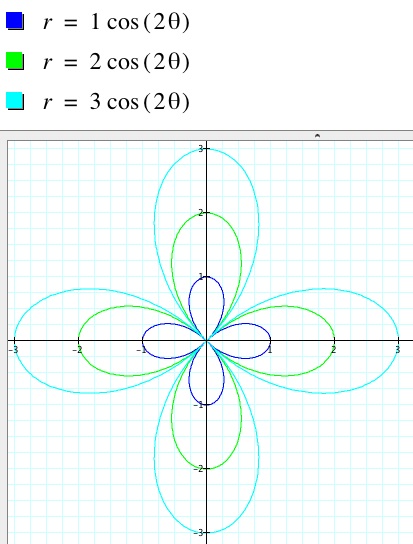
Next, let's observe what happens when a = b = 2 and a = b = 3, and let k = 2.
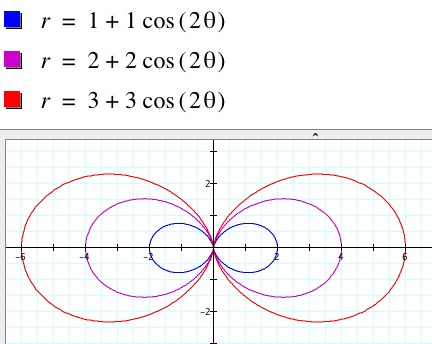
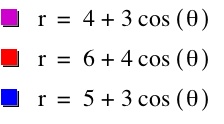
As you can see from the graph above, as the a and b values get larger the graph stretches horizontally and becomes n-times the original graph when a=b=1. Thus, when a=b=2 the purple graph is twice the size of the graph when a=b=1. When a=b=3, the red graph is 3 times the size of the graph when a=b=1. The same property holds for the graphs below.
Next, let's take a look at some of the graphs of r = a+bcos(kø) when a < b , when a > b, and k = 1. We will begin by letting a = 1, b = 2 and k = 1.
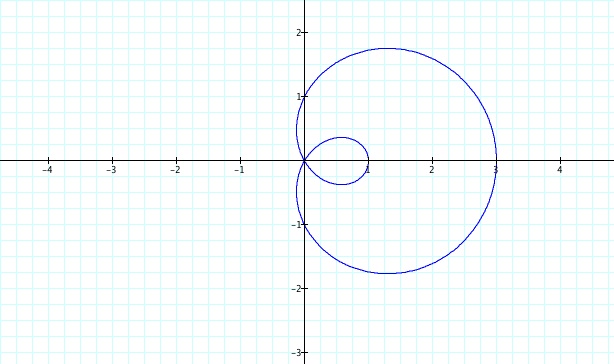
As you can see, the cardioid has developed a loop when a < b. Let's observe more graphs of this type below.
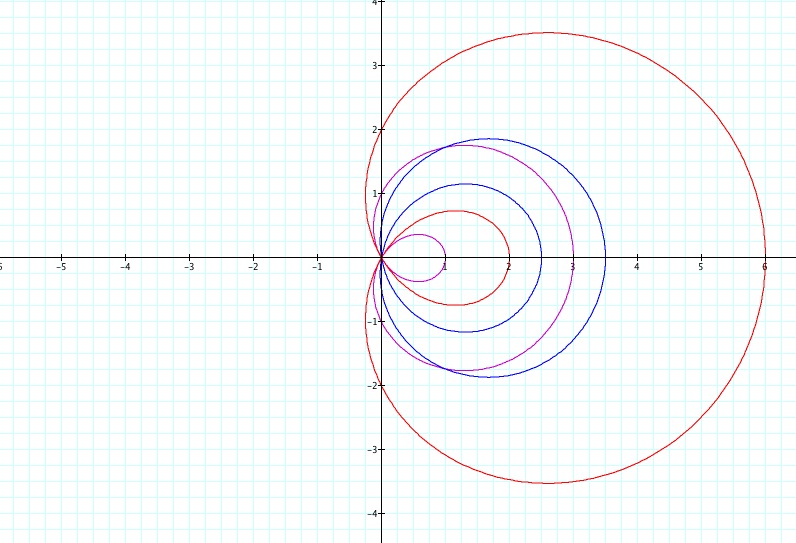
In all of the graphs shown above and in general, the loop is of the length (b-a) and the length of the limacon is (a+b). Notice when a = 2 and b = 4 (the red graph), the loop is of length 2 which is equal to b -a or 4 - 2. Also notice the length of the whole limacon is equal to a + b or 2 + 4 = 6. They all share the point (0,0). The y-intercepts are of the form (0,-a) and (0,a).
Let's focus on the equation
If the value of a is greater than or equal to 2b, the limacon is convex as shown below. It seems to have the look of a flattened surface where the loop used to be.
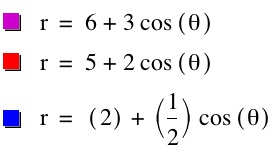
If 2a >b > a, the limacon is dimpled as shown below.
This exploration can be further extended by observing the changes to the polar equation r = a+bsin(kø) when a < b and when a >b when k = 1. It can be extended further by changing the values of k in both polar equations r = a+bcos(kø) and r = a+bsin(kø) and exploring the changes to the graphs.
To continue this investigation, let's focus more on the polar equation r = a+bsin(kø). We explored the equation r = a+bsin(kø) above when a = b = 2 and k = 1. Now we want to focus on the changes when a = b = 1 and the value of k is varied. Will the graphs look similar to the cosine graphs? First, let's graph the equation r = 1+1sin(2ø) and examine the changes.
.jpg)
The graph above has 2 pedals just like in the cosine graph. However, it is rotated about the origin 45 degrees. Next, let's examine the graph of r = 1+1sin(3ø). What is your hypothesis about this graph? How many pedals will it have? What about the graph of r = 1+1sin(4ø)?
.jpg)
.jpg)
Observe the graphs above, and you can see that the k-value coincides with the number of pedals just like with the cosine graphs. The only difference is that they are rotated about the origin by 45 degrees. Next, let's observe when a and b are not equal to 1.
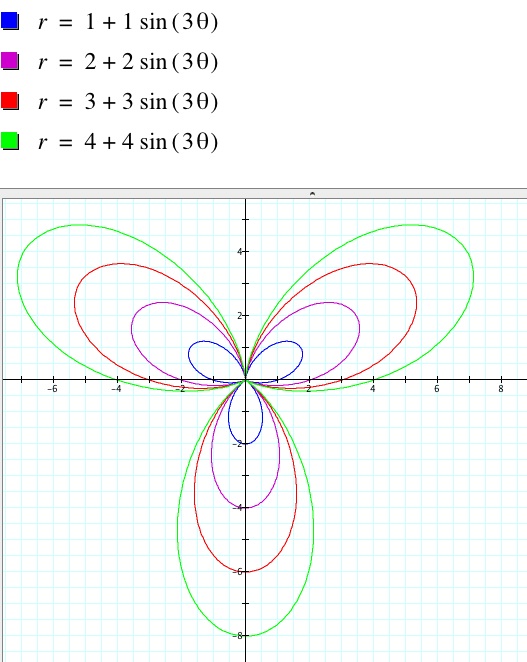
As you can see, when a and b get larger and larger, the graph stretches out and gets bigger by the value of a and b. Also observe the graph below when a and b are negative.

This exploration can be furthered by exploring the changes in the polar equation r = bsin(kø).
Also, to further this exploration even more, examine the polar equation r = a + bcos(kø + d). Do an animation over a revolution or more by replacing d with n. Observe the animation below with a = 1, b = 1, and k = 1, 0 ≤ ø ≤ 2π, and the n values ranging from -10 to 10.
What if the range of ø was between 0 and π? How would this affect the graph? Also, examine what will happen if you change the a, b, and k values.